Annual Survey of Industries (ASI) 2024-25
Context: The Ministry of Statistics and Programme Implementation (MoSPI) officially released the detailed publications—Volume I and Summary Results of the Factory Sector—along with unit-level data for the Annual Survey of Industries (ASI) 2024–25.
- The findings confirm broad-based expansion across India’s formal manufacturing sector, led by a 28% Gross Value Added (GVA) growth in the corporate manufacturing segment.

About Annual Survey of Industries (ASI) 2024-25:
What It Is?
- The principal statistical vehicle conducted by MoSPI to provide comprehensive insights into the structure, composition, capital formation, employment, output, and value addition of India’s registered manufacturing sector.
Statutory Authority: Administered under the Collection of Statistics Act, 2008 (as amended in 2017) and Rules framed thereunder in 2011.
Statutory Coverage:
- Factories registered under Sections 2m(i) and 2m(ii) of the Factories Act, 1948 (employing 10+ workers with power, or 20+ workers without power).
- Bidi and cigar manufacturing establishments registered under the Bidi & Cigar Workers Act, 1966.
- Non-CEA electricity undertakings engaged in generation, transmission, and distribution.
- Establishments with 100 or more employees listed in the Business Register of Establishments (BRE) maintained by States.

Key Data & Macro Indicators (ASI 2024–25):
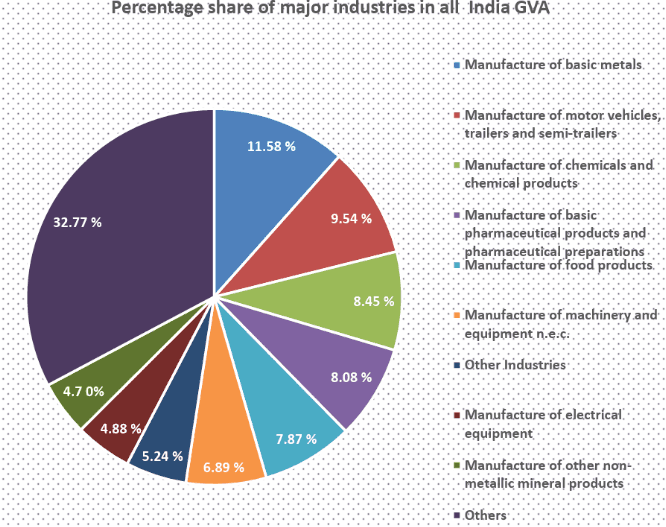
- Corporate Manufacturing GVA Expansion: The corporate manufacturing sector (accounting for >89% of total manufacturing GVA) expanded its Gross Value Added by 9.28% over the previous fiscal year.
- Operational Productivity & Value Addition: Net Value Added (NVA) per operational factory increased by 6.59%, while GVA per person engaged grew by 2.25%.
- Capital Investments in Plant & Machinery: Gross value of plant and machinery installed across registered units recorded a growth of 7.25% over the preceding year.
- Employment Expansion: Operating factories in the corporate sector grew by 3.45%, while total persons engaged expanded by 7.57% (pushing total formal manufacturing employment past 2.10 crore).
- Core Employment Drivers: Five key industries—Food Products, Textiles, Basic Metals, Motor Vehicles, and Wearing Apparel—collectively generated more than 41% of total formal manufacturing jobs.
- Regional GVA Concentration: Five leading industrial states—Maharashtra, Gujarat, Tamil Nadu, Karnataka, and Uttar Pradesh—together contributed more than 54% of the nation’s total manufacturing GVA.
Structural Composition of India’s Factory Sector:
- Investment-Wise Distribution (The Missing Middle / Capital Concentration):
- Small-Scale Base (Up to ₹5 Crore in Plant & Machinery): Accounts for 78.69% of all operational factories and employs 34.32% of total workers, but commands only 10.55% of fixed capital and generates 17.61% of net value added.
- Large-Scale Heavyweights (₹10 Crore & Above in Plant & Machinery): Represents just 15.84% of factories, yet controls 87.42% of fixed capital, engages 59.66% of the workforce, generates 76.82% of gross output, and yields 78.07% of total net value added.
- Output-Volume Disparities:
- Factories producing output above ₹10 Crore constitute 47.63% of units but account for 95.55% of fixed capital, 88.78% of employment, and 97.87% of net value added.
- Units producing less than ₹1 Crore output comprise 18.34% of factories, yet deliver only 0.08% of total gross output and a negative net value addition (-0.10% combined).
Positive Takeaways from ASI 2024–25
- Broad-Based Industrial Modernization: Sustained capital accumulation reflected in a 7.25% expansion in plant and machinery reflects healthy corporate balance sheets and capacity utilization.
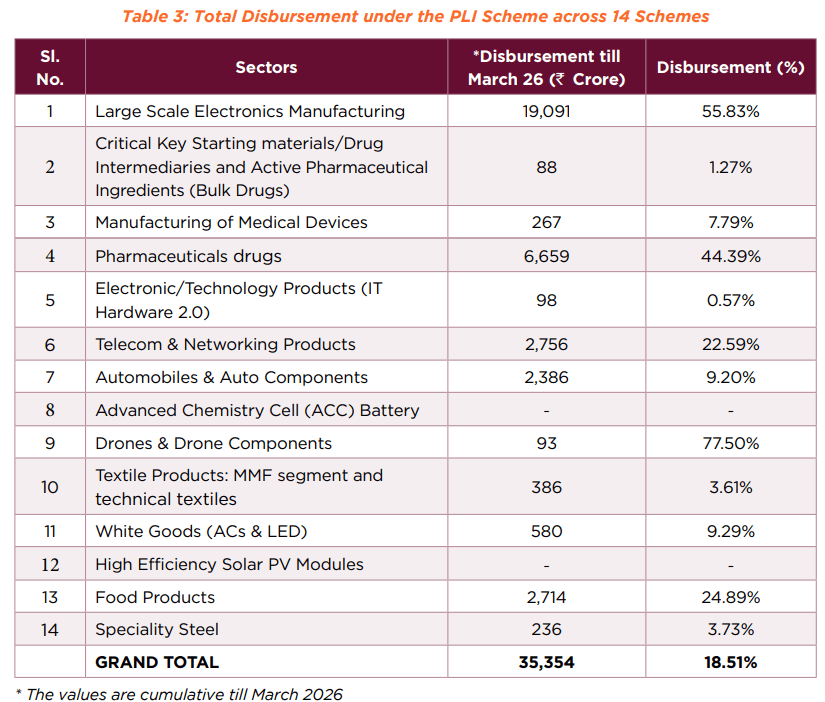
E.g., Steady capital formation in high-tech manufacturing lines under the central Production-Linked Incentive (PLI) schemes.
- Formal Employment Generation: The 7.57% growth in corporate sector employment indicates that factory additions are translating into formal wage-earning opportunities.
E.g., Labor absorption in the motor vehicle and electronics assembly corridors across Tamil Nadu and Haryana.
- Deepening Labor-Intensive Industrial Ecosystems: Strong contributions from food products, garments, and textiles prove that traditional employment-generating sectors remain resilient.
E.g., Apparel and textile clusters in Tirupur, Surat, and Noida continuing to employ large rural-to-urban migrant workforces.
- Consolidation of Factory-Level Efficiency: A 6.59% growth in net value added per operating factory highlights improving operational margins and managerial efficiency.
E.g., Adoption of automated process engineering and shared supply-chain digital platforms lowering per-unit production costs.
Structural Challenges & Fault Lines:
- Persistent Capital & Value Concentration: Nearly 80% of operating factories generate less than a fifth of national value added, highlighting the persistent low-capital, low-productivity trap among smaller enterprises.
E.g., Small unorganized-tier engineering job shops unable to upgrade machinery, remaining tied to low-margin subcontracting.
- Skewed Regional Industrialization: Over 54% of manufacturing GVA is concentrated in just five states (Maharashtra, Gujarat, Tamil Nadu, Karnataka, Uttar Pradesh), leaving eastern and central regions industrially underdeveloped.
E.g., Mineral-rich eastern states functioning primarily as raw material extractors rather than high-value manufacturing hubs.
- Modest Labor Productivity Growth: While corporate GVA expanded by 9.28%, GVA per person engaged grew by only 2.25%, signaling that wage growth is constrained by lower productivity improvements.
E.g., Slower integration of advanced robotics and continuous upskilling across tier-2 and tier-3 factory workforces.
- Sub-Scale Viability of Micro Units: Over 18% of operating factories generate less than ₹1 Crore in annual output and operate on wafer-thin or negative net margins (-0.24% NVA for units under ₹25 lakh output).
E.g., Micro-manufacturing units struggling under high compliance costs, volatile raw material inputs, and high power tariffs.
Way Ahead:
- Scale Up Technology Adoption for MSME Factories: Launch targeted credit-linked capital subsidy schemes to help factories in the Up to ₹5 Crore tier upgrade to automated CNC machinery and digital enterprise systems.
- Decentralize Industrial Corridors to Eastern States: Leverage the PM Gati Shakti National Master Plan and dedicated freight corridors to establish industrial parks across eastern states (Bihar, West Bengal, Odisha, Jharkhand) to correct regional GVA imbalances.
- Expand National Apprenticeship & Shop-Floor Reskilling: Restructure vocational training through the National Apprenticeship Promotion Scheme (NAPS) to lift labor productivity (GVA per worker) in line with capital growth.
- Incentivize Factory Aggregation & Plug-and-Play Clusters: Develop shared common facility centers (testing labs, effluent treatment plants, power grids) to help sub-₹1-crore output units scale up into economically viable entities.
Conclusion:
The Annual Survey of Industries 2024–25 demonstrates strong resilience in Indian manufacturing, highlighted by a 9.28% corporate GVA expansion and rising factory employment. However, the sharp divide between a small group of high-output, capital-intensive firms and a large base of low-productivity units remains a structural challenge. Unlocking India’s goal of raising manufacturing’s contribution to 25% of GDP will require modernizing this small-scale factory base, bridging regional disparities, and boosting labor productivity through targeted industrial reforms.
Examine the role of price indices in GDP calculation. Compare the suitability of WPI and CPI in India’s context. Suggest improvements in deflator methodology.